How to Build a Personalized Immune-Health Tracking Dashboard
Health Enthusiast: A Holistic Guide and History of Healthy Living Welcome to Health Enthusiast, your trusted portal for exploring the roots of medical history and finding the best healthy lifestyle tips. Through https://www.ratirossie.cfd/, we bridge insights into the history of human health with the most up-to-date information on healthy living tips. Discover the origins of various nutritional diet guidelines, learn about the evolution of exercise routines over time, and understand proven methods for maintaining mental and physical health. Make this platform your daily partner in achieving a better and more balanced quality of life holistically. Thank you and happy reading.
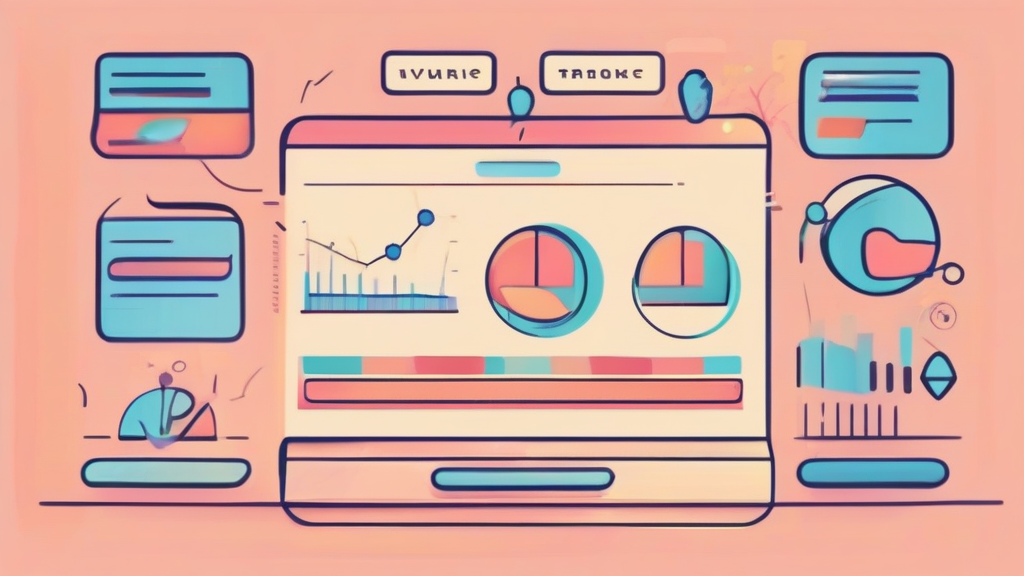
If you are serious about wanting to track immune system progress, you need to stop looking at random health stats and start building a unified dashboard. Most people treat their health like a junk drawer, tossing in data from smartwatches, blood tests, and symptom journals without ever seeing the big picture.
Key Insights
- Your resting heart rate and heart rate variability (HRV) act as the leading indicators for systemic inflammation.
- Objective data, like CRP levels from blood work, must be paired with subjective symptom logging to be actionable.
- Consistency in data entry is more important than the sophistication of your tracking software.
- Baseline stability is the goal; sudden deviations are your early warning system.
Think of your immune system like a security guard. If you only check the logs once a month, you won't know if the door was left open last Tuesday. You need a centralized dashboard to identify trends before they manifest as a full-blown illness.
Why You Must Track Immune System Progress Through Data
The immune system is a complex network of biological processes, not a single light switch you can flip. To understand it, you have to monitor the homeostasis of your body. When your HRV drops while your body temperature climbs, your system is likely fighting an invisible battle.
Most commercial apps silo your data. Your sleep tracker doesn't talk to your blood work results. By manually aggregating these metrics into a tool like Notion, Airtable, or a custom Excel sheet, you create a feedback loop that reveals how your lifestyle choices actually impact your defenses.
| Metric Category | Data Source | What it Signals |
|---|---|---|
| Physiological | Oura / Whoop / Apple Watch | Recovery capacity and stress load. |
| Biometric | Lab tests (CBC, Vitamin D, CRP) | Internal inflammation and nutrient status. |
| Subjective | Manual Logging | Energy levels, brain fog, and symptom onset. |
Steps to Build Your Personalized Dashboard
Start by choosing a single platform. I prefer Notion for its flexibility. Create a database where you log your daily recovery score, sleep duration, and one subjective rating for "gut health" or "general vitality."
Next, integrate your biometrics. Every 90 days, update your dashboard with blood work markers. Compare these against your previous entries to see if your supplement protocols or diet shifts are moving the needle. If your C-reactive protein remains high despite improved sleep, you know your lifestyle adjustments aren't hitting the root cause.
Automate where possible. If you use a wearable, use Zapier to pipe your nightly HRV and temperature data directly into your dashboard. This eliminates the friction of manual entry. Without automation, you will quit within a month. I guarantee it.
How to Interpret Your Data Trends
Avoid over-analyzing day-to-day noise. Your immune health isn't defined by one bad night of sleep. Look for multi-week moving averages. If your seven-day rolling average for resting heart rate creeps up by 5% over three weeks, it is time to reduce intensity and prioritize recovery.
Use your dashboard to tag external stressors. Did a high-travel week coincide with a drop in your immune metrics? This isn't just data; it is a blueprint for your personal resilience strategy. You are essentially building a diagnostic tool tailored specifically to your biology.
Frequently Asked Questions
Can a spreadsheet really predict illness?
No, it cannot predict the future. However, it can identify physiological "pre-illness" patterns, such as declining HRV and elevated respiratory rates, that consistently precede your personal sick days.
How often should I update my lab markers?
Quarterly is the industry standard for most healthy individuals. If you are actively working on a specific deficiency, monthly testing provides the granularity needed to adjust your interventions.
Is manual logging worth the effort?
Absolutely. The act of recording how you feel forces you to be mindful of your body. This subjective data often provides the "why" behind the raw numbers provided by your wearables.
Stop guessing about your health and start measuring it. Build the dashboard, commit to the input, and let the data dictate your recovery protocol. Your future self will thank you when you avoid the next burnout cycle.
You should leave a comment for me to be more enthusiastic in writing articles and Google will like my beautiful and pretty website.
Post a Comment for "How to Build a Personalized Immune-Health Tracking Dashboard"